Friday, November 16, 2012

Quick Posts

I have been asked recently by a reader to shorten my posts (and to make them more often) – this I promise to do starting in 3, 2, 1….

As we enter Week 11 of the NFL season I have a few observations based on our scoring…

- The recent “rise” of the Tampa Bay Buccaneers has nothing to do with Josh Freeman.  He’s still scoring at the bottom of the league as far as QBs go.  When will the experiment end?  This guy to going to be a GREAT backup QB somewhere, as a starter though he continues to make (rookie) mistakes.  At this point in his career he should be playing much better than Andrew Luck and well, he isn’t.

- The Gabbert experiment in Jacksonville is also near completion.  The result?  Well, because he “bet his career” on the development of this mid(low) level talent, Gene Smith will probably lose his job.  Ironically in the offseason they signed Chad Henne – who you might remember as scoring VERY well last year in the four games with the Dolphins before injury.  How well?  Like Brady/Brees/Eli well.  Unfortunately this is an obvious case of “new coach syndrome” and the GM is deciding which QB to start – NOT a good way to run a team.

- The Romo coaster continues in Dallas and I will say this, Tony has scored fairly well this year – at least the times he’s not been lying on his back.  The offensive line there has been atrocious and since I think the talent is there (expensive talent I might add) there must be something else at play.  Unfortunately for Jason Garrett (who I think is one of the brightest up and coming minds in football), the masses in Dallas (including it’s owner) are an impatient lot.  I’d be surprised if he gets another year to pull things together, there’s just too many good (experienced, super bowl winning) coaches out there looking for a job.

Speaking of that…

- Like you, I’ve seen the hirejongruden.com web site.  There is NO freakin’ way that guy is going to coach any team at the collegiate level.  I mean, he can barely stand rookie QBs, what would he do with an 18 year old freshman?

OK, I said I would keep it short, going to keep my promise.

More next week!

Peace, out.

Wednesday, June 13, 2012

Let’s talk golf!

As you probably know this week is US Open week.  Now, being from Augusta I’m more inclined to be excited about Masters week (I typically hum the tune “it’s the most wonderful time of the year” during that week much to the chagrin of those I am around) but I do recognize the US Open as typically being the “greatest test of golf”.  There are some years (anyone remember the fiasco at Shinnecock?) when I think the USGA goes too far and sets up a “goofy” golf course and I certainly hope that doesn’t happen again here.  San Francisco is known to have it’s share of “goofy golf” courses and typically the Lake Course at Olympic is not one of them – let’s hope the USGA gets it right this time.

I’ve also been pondering golf analytics.  I mentioned some useless pieces of information in my previous post (putts per round, greens in regulation, etc) and started wondering, OK Bryan, you’re so smart, how would YOU build an analytics model for golf based on nothing but the qualitative results from a golf round.

After much thought, here’s my first go at it…

First of all I think there are three segments to the game: tee to green, around the green and putting.

Tee to green is pretty straightforward and you can in fact use a “sensor” based input to assist in this.  Basically define the areas of the fairway that are “ideal” for the player to hit to in order to set up his shot to the green.  Obviously these are only valid for par 4 and 5 holes.  These “ideal” locations can change based on hole location (those change in a tournament every day) and they can also change according to conditions (wind, rain, etc).  Once you have these, you can put some use (finally!) on data produced by a system like Shotlink by using their precise measurements to figure out where exactly the ball ended up in the fairway.

Par 5s in this situation would be a bit more difficult in that you would need to measure a players quality of shot going for the green in 2 vs. their layup position, but it could be done with a qualified observer.  (i.e.. were they really going for it or did they just badly mishit their shot?)

Par 3s you would qualify the shot based on where on the green (hopefully) the player left the ball.  There is such a thing in golf as a “good miss” so you would also need to observe the strategic use of “bail out” areas for particularly difficult or dangerous shots (no such thing on the 17th at Sawgrass, right?).

Coming into the green would be even easier.  Based on where they are in the fairway (are they in a 8-10 position or worse?) how well did they fare?  If they’re lying in a 9 or 10 position and promptly chunk it into the front right bunker, well you can imagine that’s not going to score very well.

Once near the green, meaning just off the green or in a greenside bunker or collection area it would also be straightforward to judge how well the ball is played close to the hole for a birdie or par-save opportunity.  Speaking of par-save opportunities, we could also enable a “scrambling” factor on how well the player recovers from a bad shot anywhere on a given hole.  In fact, in some cases you would probably get multiple observations for scrambling.

And finally, the players quality putt on the green.  As I mentioned before I spent a lot of my younger days in Augusta and have been to probably 30 Masters tournaments.  There are some places on that golf course that you simply do NOT want to go.  Some examples:

  • back bunker at number 7 with a front right pin location
  • back or middle tier of the green on 9 with a front hole location (brutal false front there that rolls 30 yds back down to the fairway – the worst “walk of shame” in golf IMO).
  • back bunker on 12 with the Sunday pin location
  • anywhere, and I mean ANYWHERE right of the green on #4
  • over the green on #14
  • back bunkers on #16 with Sunday pin

Why do I mention bunkers when we’re talking about putting?  Typically when you’re in the bunker you are playing your –1 par shot (different for Par 5s when you’ve gone for the green, yes I know) so the placement of this greenside bunker shot is critical.  In the case of #7 at Augusta for example, you want to leave your shot “below” the hole leaving an uphill putt, but if you run it too far by the hole you may end up in one of the front bunkers (which isn’t an easy shot either) or rolling between the bunkers and back into the fairway.  #7 is a particularly brutal green and you also don’t want to necessarily leave the ball “above” the hole leaving yourself with a very fast, typically hard-breaking putt for par (or worse).

There are also putts at Augusta when it’s almost impossible to aim at the hole.  Everyone remembers Tiger’s shot a few years ago at #16 from just off the green, but they don’t remember Davis Love’s putt earlier in the tournament from across the green.  Davis has to putt up onto the hill (90 degree angle AWAY from the hole) to catch the hill properly and make an improbable birdie.  When he was lining up his putt, he had his BACK to the hole!

So what does this mean for putt scoring?  Again, a qualified person needs to observe what’s going on.  The fairway observations can be made with the assistance of the Shotlink system, but around the green, scrambling and putting must all be “observed”.

Think this would take a lot of manpower?  Have you ever been to a golf tournament and watched the cadre of people that walk along with a typical weekend twosome?  I bet you that all of those people know the game of golf and even if they’re already busy it wouldn’t be a big deal for one more person to be there.  OR just station someone in the fairway and green for every hole.  Every tournament has more than their share of able-bodied volunteers.  Heck, I just filled out my form to volunteer for next year’s open at Pinehurst!

There’s a lot of useless information presented in golf telecasts.  Just like “statistics” you can mix/blend these to make any point that you like – Johnny Miller is a master of useless statistics.  The point of golf is scoring low of course and a guy who chips in from the bunker for par is scored exactly the same on the score sheet as the guy who lips out a 4 ft. birdie putt and taps in.  This method tells you more of “how well” someone is playing despite the score.  You can’t be lucky ALL of the time!

As always dear reader, ask why and ask is what you are being presented with really tells you what’s going on in the game – ANY GAME!

rsa_golf1

Tuesday, May 15, 2012

Useless “stats” (continued)

Let’s talk some golf…

First of all, a little background.  I grew up in Augusta.  When you grow up in Augusta (the “mecca” of golf) you play golf.  Actually I was introduced to the game by my grandfather in S. Illinois, but that’s a story for another day.  The net, net is that I’ve played golf and followed it closely since the age of 7.  The game fascinates me and I find the traditions, history, etc just as exciting today as ever.  In fact, I’m a big fan of Tim Finchim even if others are not.  I think he’s acting as a great caretaker for the “greatest game ever invented”.  I also think that the Masters is not only golf’s greatest spectacle, but probably the greatest spectacle in sports and certainly the hardest ticket in sports to acquire.  I’ve been fortunate enough to attend roughly 30 Masters golf tournaments and I still get the “goose bumps” up and down my body when I step on the premises.  For those of you who are wondering, I play once every 6 weeks or so, but still maintain a solid 12 index.

So yesterday was not only the conclusion of the English Premier League (which was completely crazy and awesome by the way), but it was also the final round of the players championship at the TPC Sawgrass.  Commonly known as golf’s “fifth major” and broadcast around the world just as a major, it is a great tournament to watch.

Just as I admire Mr. Finchim and his leadership of the PGA I absolutely hate to watch any tournament where Johnny Miller is commentating.  I have the pleasure to know several club pros and a few golf course superintendents and Johnny, NO the ball does not break “away from the setting sun”.  Maybe your early exit from the world of professional golf involved watching the setting sun and focusing on “grass” too much (“yips” anyone?).

Mr. Miller aside, today let’s talk about some of the “useless” stats related to golf.  Let’s start with one of Mr. Miller’s favorites is number of putts per round.  Golf is an easy game, you hit your drive to the fairway (on par 4s and 5s) hit one or two other shots, hit two putts (no more) and you’re going to shoot par or somewhere thereabouts.  On the par 3s you hit one shot, two putt and repeat.  Nonetheless, 36 putts for 18 holes is considered excessive (except maybe for a US Open) and anything around 20 putts is viewed as pretty good.  Now, why does this NOT make sense?  Let’s have a short story…

A few years ago I attended a friend’s wedding in Chicago.  It was bitterly cold, but he insisted on playing golf so out we went (with some liquid antifreeze in tow of course).  The “game” we were playing that day involved a deck of cards.  Essentially, if you one putt a green you got a card, two putts nothing and three or more putts you had to throw $5 into the kitty.  At the end of the round, you took the earned number of random cards from a standard deck and played straight poker for the money in the pot.  In our case it was around $200.

What I observed during this game is that the really good golfers would NOT play for the flag.  In fact, they would try to pick a nice landing surface just off the green, play to that, chip up close and try to make their one putt (for a card in the poker game).  Guys like me that were trying to hit to the center of the green and two putt ended up with only a couple of cards.

See my point?

Who cares how many putts you had?  You could have 18 putts, have missed every single green, some of those putts might’ve been for par, many might’ve been for bogey (or worse), but you had a great putts per round stat!  Johnny will love you if you average 18 putts per round!  (even if you shoot 82)

How about another short game statistic – greens in regulation (GIR).  My problem with GIR is that some of these greens are HUGE.  You could be just off the green and 10 ft. from the hole (collar) and NOT have a GIR or you could have a GIR but 70 feet from the hole on the wrong side of the green (a.k.a. three putt city).  GIR is supposed to be a metric to show how well a golfer is hitting his irons into the green.  In my opinion it is anything but.

I can say the same thing for driving distance.  Who cares?  If driving distance really mattered then Zach Johnson, Mike Weir and Fred Funk wouldn’t even be on tour!

Here’s two that I do like. (let’s try to end on a positive note)  I do like driving accuracy, you obviously need to hit the fairway to win tournaments (most of the time).  I also like how “putt feet” is starting to be analyzed to show how well someone is making putts.  (It’s taking the measurement of all the putts made and adding that number up over the round – obviously the higher the number the better the putter).  I’d like to see more of “average distance away from the hole for birdie” – that would be a pretty cool stat.

The surprising thing in all of this is that there are people doing golf broadcasts that I really like and who really know the game (Nick Faldo, Kelly Tilghman, Roger Maltbie, Gary Koch) – why don’t these guys think of this?  With systems like “shotlink” in existence it’s extremely easy to get the measurements of where the ball is all of the time.  Define where the ball “should be” on the different holes and measure how well the players hit those targets.

I’ll happily volunteer my services to help by the way!  Keep it in the short grass everyone!

Thursday, May 10, 2012

Soccer (aka “Football”)

I’ve been thinking about writing a blog entry for football (yes, I’m going to call it football for the purposes of this blog) for some time now.  Previous to 2006 I never, ever watched soccer.  I know that my high school had a soccer team, but it was during track season (and prom season) and I just didn’t pay that much attention to it.  I also attended the gold medal match during the 1996 Olympic games, but I was really just there for the party (and it WAS a lot of fun).  But before 2006 I just really didn’t pay too much attention to football.  Why 2006?  That’s the year my son turned 5 and started playing.  Yes Virginia, you may have heard of “soccer moms”, but in 2006 I became a fully fledged “soccer dad”.

Even though I would go to the weekend soccer games and cheer on my son I still didn’t consider myself a “fan” and certainly not a student of the game.  That all changed a couple of years ago during a Saturday with nothing to look forward except yard work and a “honey do” list a mile long.  The Super Bowl was two weeks in the past and the doldrums of spring and summer were upon me with the prospect of no football.

While sulking and channel surfing past the bowling, figure skating, basket weaving, etc I ran across an EPL match.  I don’t even recall what the match was, but it was riveting.  That 110 minutes or so was enlightening, a football fan was born….  Finally!  A sport that I could watch in the long (American) football off-season that was just as intense and just as intriguing to follow!  My wife was overjoyed that I had found a sport that glued myself to the TV for the remaining 6 months of the year.

The “long and short of it” is really that even though I didn’t grow up around the sport I have become a great fan of the game.

So today I would like to discuss two of the metrics that I see that seem to be at the heart of most discussions for football.  Just as Kirwin pointed out in his book (“Take Your Eye Off The Ball”) I’d like to ask soccer fans everywhere to pull their attention away from these useless stats that they’ve always been fed and ask the most important question of all (So WHAT?!?!).

First, distance run.  Well, where to start?  For those of you that aren’t familiar with the concept, several companies in the past few years have developed technology that allows the physical tracking of players as they move around the field.  This feeds x/y coordinates of the players on the field, their average speed and the total distance (typically reported in kilometers or meters) that the player has covered during the course of the game.  It’s really fascinating stuff.

So what?

What does distance covered really tell you about the performance of a player during the game?  Absolutely nothing.  A couple of years ago at the sports analytics conference in Boston one of the EPL staff members using this technology actually lamented the meaningless data it produced.  In this particular case a keeper was augmenting his “distance run” metric (after being cajoled by some coaches) by running back and forth across the box while the ball was on the other end of the pitch.  Not making any plays, not doing anything productive for the outcome of the game and certainly not doing anything to help his team (aside from some extra conditioning), just trying to get that particular STAT better and get the coaches off his back.

I won’t even go into why I think average speed is idiotic.  Based on what I’ve just said I think it’s obvious…

#2, passing %.  Basically Player A passes the ball to Player B X number of times.  Y number of times the pass was successfully received by Player B, therefore the percentage is simply Y divided by X.  Now you ask, what fault could I find in a perfectly good statistic that represents teamwork between two players on the same team?  Well, football is definitely a team sport.  It’s definitely helpful to have your players working together.  But, it’s also a sport of speed and continuity.  If Player A passes to Player B while in a full run about to blow by a flat-footed defender and Player B has to completely halt all of his momentum to go back and get the ball (because bone head Player A didn’t lead him enough) then it is considered a successful pass and counts in the Y column.

Really?  There was an opportunity for a breakthrough on the defense, possibly a good, quality shot on goal, but the pass was poor.  But wait!  Even though the pass was poor and completely killed the opportunity, the pass was “received” and therefore it counts in this statistic.

(One of the many reasons I hate dumb, automated statistics like these.)

Neither of these pass the “So What?” test.

Look at statistics like this and ask yourself “So What?”.  Who cares how much distance a guy ran?  Maybe he was having a horrible day and giving up the ball every chance he got and spent his 8 km chasing the guy who just stole the ball from him?  As an example, Messi’s distance stat during a game is not impressive – have you ever watched a game and really focused on him?  He puts himself in the right place at the right time and he’s fresh for the entire 90 minutes.  (see this article from a couple of years ago, sorry Bleacher Report, but you guys were WAY off on this one).  You don’t get that running 10 or 12 km per game, you get that by playing SMART.  The same can be said for Rooney – who’s always back there heckling the keeper to hurry up his kicks?  Why is he back there?  He typically sets himself up just onside - you hardly ever see this guy on the defensive half of the pitch…

The same for passing accuracy.  If the pass isn’t a quality pass and actually prevents the receiving player from doing something “good” then it shouldn’t be counted as a positive event in the course of the game!

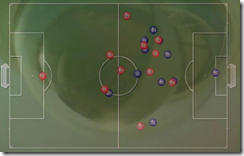
Those x/y coordinates produced by these technologies are good for one thing though.  You can “virtualize” the game where all of the players on the field are represented by circles and squares.  It’s really cool to watch all of those little shapes move around the field, it’s almost like WATCHING THE GAME.  A huge amount of money is spent on these technologies and all they’re getting for that money is something that I spend $12/month to receive (no, this isn’t a DirecTV commercial).
image

The bottom line?  You are smart, you’re on the internet and you’re reading a blog.  Question these stats and demand more.  Ask the “So What?” question as often as possible and don’t stop until you’re satisfied with the answer.  If you want to know more about what I think are “real” metrics that measure the “real” performance of these fantastic athletes, let me know.

Wednesday, February 22, 2012

The circus is in town!

At least if you live in Indianapolis that is.

Today marks the opening of the 2012 NFL combine and it also represents the day that I typically publish my annual rant on the “circus” also known as the NFL combine.

Gosh, where to start…

Let’s begin “at the beginning”.  Those wonderfully straight lines are drawn for the 40 yard dash.  The pickets are up for the vertical leap.  The cones are laid on the field for the shuffle.  And the pens and pencils are all prepared for the Wonderlic test.

With the exception of that last point if you didn’t know any better you would think that a track meet was about to take place in Indianapolis.

Let’s start with those wonderfully straight 40 yard dashes.  First of all, these guys will NEVER, EVER run 40 yards in a straight line wearing nothing but shorts, a t-shirt and running shoes.  They will always be pursued by others trying to bring them down and (hopefully) NOT running in a straight line.  They will always be wearing at least 15 lbs of gear including a helmet.  And why, oh why is this only a 40 yard dash?  Last time I checked the football field was 100 yards from goal line to goal line.  Why not let them run 100, 80, 60 and then 40 and time them?  After all these guys are world class athletes right?  They will sometimes have the opportunities to run THOSE, more appropriate distances.

Now, the vertical jump.  Very, very rarely will a player who tests out on this be able to jump freely (again without wearing any equipment) for a goal.  My only recollection of a player doing any sort of jump like this is the Saint’s Jimmy Graham!  Almost always there will be two, three or maybe even four guys going up for a ball at the same time.  Put some pads and a helmet on these guys and then have a couple of cornerback prospects attempt to grab the “goal” at the same time and then you might have something more realistic.

My favorite is the bench press.  I saw a video the other day where someone was trying to justify the bench press as a good measure of “endurance”.  Really?  How many times have you seen a guy pump out 25 reps in the middle of the field at the end of the 4th quarter to prove his endurance?  It’s similar in motion to a push up, maybe this is in case they do something on the field really, really dumb and their (ex-military) coach orders them to “drop and give me 50!”.  Ok, that I can buy, sort of….

And last, but not least we have the cones.  Yes boys and girls even though these guys have spent the last 3 or 4 years running away and between 6ft 250lb guys the ultimate test of their AGILITY will be to run between 12 inch stationary cones.  Heck, if you only had to take on 12 inch cones I might’ve had a shot at the NFL!  In a multi-billion dollar industry this is the best you can come up with to attempt to measure one of the most important facets of the game?  Really?  C’mon man.  (the link is one of my favorites from last season by the way)

So what are we really trying to accomplish here?  I mean, how did this get so convoluted after all?  If you answer “the media” I think that’s partially the answer.  Fans are SO HUNGRY for anything in the off-season even remotely related to football, they are going to watch the combine coverage – no doubt.

Another point to ponder is do NFL franchises really look at the NFL combine to make any sort of decisions?  Yeah, they send guys there (junket?) and they carry clip boards and sit in the stands and LOOK like they’re paying attention.  But, how much do they really put on this?

But, back to the first question – what are we trying to really MEASURE within this circus?  I think we’re trying to evaluate (predict?) how well a player is going to perform in the NFL.  (In actuality I think we’re measuring how well these guys would do in a track meet.)

So how do you measure how well someone performs on a football field?  Well, I think you would watch them during a game, on a football field.  (At least the combine IS taking place on a football field, mostly…)  Then, when watching them on the football field, how would you measure them?

Well dear reader, like anyone who’s ever been to Disney will know – when the ride ends, you end up in the gift shop.

Evaluating REAL performance in REAL situations with REAL players in REAL games is what REAL SPORTS ANALYTICS is all about.

Enjoy the entertainment this week coming from Indianapolis!

Monday, November 28, 2011

A couple of changes


Well, after much encouragement from some of my co-workers and friends I have signed up for Twitter.  If you enjoy being bored and hopefully (from time to time) entertained 140 words at at time feel free to start following me at http://twitter.com/#RSA_Bryan.  I am planning on attending the MIT conference again next spring and will be “tweeting” from there.  Last year’s conference featured attendees tweets on the big screen in between sessions and provided some nice entertainment on the breaks.


There is a lot to talk about in football.  Some early guys who were grading out very well (Josh Freeman for example) are fading.  I’m not sure where to begin on grading Tebow - we may need to develop special grading metrics just for him (maybe “Wildcat” or “TE playing QB”?).  And of course, the old reliables (Brady, Rogers, Manning2) are confidently making their way through their respective schedules en route to leading their teams to another playoff appearance.  Brady’s game yesterday against the Eagles was one of the most dominating performance by a QB that I’ve seen in a long time.  It reminded me of watching Montana during his prime in that awesome Bill Walsh offense.

Unfortunately, I can’t provide much as far as insight for the later part of the season except for a big “I TOLD YOU SO”.  The Patriots juggernaut, sans a few defensive hiccups, is rolling along again and most of their problems there can be traced back to the injury bug (did you see they had a wide receiver playing defense yesterday???).  The last team to handily defeat the Patriots (Green Bay) is rolling as well.  Everything that I just said above about Tom Brady can also be said about Aaron Rodgers.  They both are just playing great with Green Bay’s defense getting the edge on overall team ratings.


In my last post I revealed that Real Sports Analytics “LIVE” is now available and a few of you have signed up and provided some excellent scores.  I was taking a look at the model this morning and I hate to ask, but I need more!  We really only have a handful of players scored so nothing can really be published on overall team strengths at this point (except for the obvious ones mentioned above).  Please sign up, even if you can only provide 10-20 observations for the games you are watching it really does help.  I can take those 10-20 and mix them in with others and we get some really good information.  I will be publishing those results to my members in the very near future.

In the meantime, I hope everyone had a great Thanksgiving and (as Mark Cuban tweeted) that you recover quickly from your food coma (me included).

Friday, September 23, 2011

And now the time has come to get serious

Recently I was speaking to a colleague in the analytics business. He had just finished reading “Moneyball” and was questioning me about Real Sports Analytics. During the conversation he referred to me as the “Billy Bean” of professional football. First of all, that’s quite an honor. To be compared with anyone with that much intelligence and perseverance is something I value tremendously. Secondly, I’m hoping that the underlying statement there isn’t about fighting an uphill battle or how desperate the situation may look sometimes. I’ve always been a believer in “what doesn’t kill you makes you stronger” so maybe that 2nd part isn’t such a bad thing after all. I can only hope to have ½ the success that Billy has had pursuing his goals.

So, with that tidbit out of the way, you’re probably wondering about the title of this blog post. Well, this idea is something that I’ve been tossing around for a while and I’ve finally gotten around to doing it.

Today I am announcing the availability of the Real Sports Analytics “LIVE” web site. The LIVE web site allows you, the reader and sports aficionado, to actively participate in scoring and seeing the LIVE results of the Real Sports Analytics solution in action. Here’s how it works…

http://www.realsportsanalytics.com/live/login.php

Click on the link above or the one provided below and sign up. The sign up process is short and sweet and basically gives me just a little bit of information about you. Please use the text entry box to tell me a little about yourself and your experience with sports. In return, I promise not to spam you or to share your information with anyone else. I will also send you the one page instructions and the Real Sports Analytics scoring sheets that you will use while watching football over the weekend (these are also available anytime in the “downloads” section of the web site). I’d like you to score the entire game, but I’ll be happy with 20-30 observations per game. Pick one or two players (it’s easiest to pick one on offense and one on defense for example), look at the skills/actions and rate their performance on a scale of 1-10. 1 being a complete “bone-head” play that gave the other team a great advantage to win the game, a 10 being a fantastic play that directly impacted (for the positive) their own team. Scores of 3 through 8 are medium type of plays that should’ve been made anyway and you’re really grading on how well they did them. Again, the lower the score the worse the performance, the higher the score, the better the performance.

E-mail these scoring sheets (Excel documents) to me and I will run them through the current Real Sports Analytics model. As I’ve mentioned before in a previous post, the more data the multi-dimensional model is fed, the smarter it can become. I’m thinking that by the 3rd or 4th game of the season we will definitely start to see some real trends emerge that can assist YOU in your fantasy (or other) endeavors and I will also start tuning the metrics and their associated weights to better reflect the actual game results.

I will publish the results on the LIVE web site each Wednesday and will send out a mass e-mail letting you know the results are available. (I’ll probably only do this for the first few weeks, remember, I promised NOT to spam you.)

Now, the two most important things:

1) The first 20 people who sign up and remain active scorers will always have full access to my web site, for free, for-ever.

2) The top scorer each week (that means you) will receive a $100 VISA gift card. The top scorer status is completely arbitrary and up to me – I’m looking for good scores, did you really watch the game and how much your scores match or don’t match with other submitted scores. As an example if most of my scorers score out Tom Brady at around an 8 and you’re results point to a 2, I’m probably going to question if you were watching the right game/player.

So please sign up and tell your friends! It’s time for some football!